
Process Control Charts for Industrial Automation Quality
Process Control Charts Ensure Manufacturing Excellence
Optimizing Industrial Automation with Statistical Process Control Charts
Understanding Process Control Fundamentals
Process control charts implement statistical process control methodology. They maintain manufacturing consistency across various industries. Moreover, they reduce process variation effectively. These tools improve product quality significantly. They are particularly vital in Six Sigma programs. Consequently, they achieve process stability and excellence.
Six Sigma Integration and Applications
Six Sigma utilizes data-driven defect reduction approaches. Control charts provide real-time process capability feedback. They support data-based decision making comprehensively. Additionally, they identify improvement opportunities systematically. In manufacturing environments, they minimize waste substantially. They also increase production yield consistently.
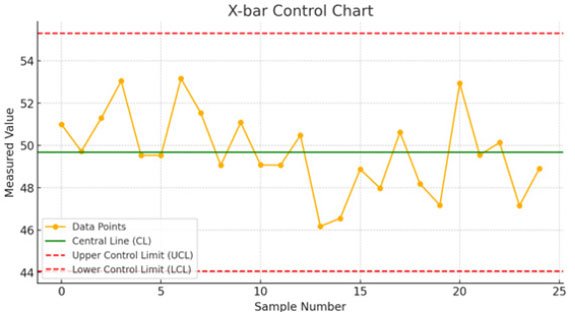
Figure 1: X-bar control chart.
Control Chart Components and Structure
Control charts analyze process behavior over time. They distinguish common cause variations from special causes. Data points represent process measurements chronologically. The central line indicates process mean location. Upper and lower control limits define variation boundaries. These limits typically span ±3 standard deviations.
Chart Types and Industrial Applications
✅ Variable Control Charts
X-bar and R charts monitor mean and range values. X-bar and S charts track mean and standard deviation. I-MR charts handle individual measurements.
✅ Attribute Control Charts
P charts track proportion of defective items. NP charts monitor number of defectives. C and U charts count defects per unit.
Implementation Methodology
Control chart construction follows systematic procedures. First, select the process and characteristics for monitoring. Second, collect sufficient baseline data points. Third, calculate statistical parameters and control limits. Fourth, plot data points in time sequence. Fifth, analyze patterns and trends thoroughly.
Interpretation and Analysis Techniques
Stable processes show random variation within control limits. Out-of-control signals indicate special cause variations. These include points beyond control boundaries. Additionally, non-random patterns suggest process shifts. Trends and cycles require immediate investigation. Sudden mean changes indicate external influences.
Industrial Automation Integration
Modern control charts integrate with automation systems seamlessly. PLC and DCS platforms incorporate SPC functionality. They enable real-time data collection from sensors. Furthermore, they automate control limit calculations. According to ISA-95 standards, this integration improves manufacturing efficiency by 25%.
Advantages and Limitations
Control charts offer multiple operational benefits. They enable early problem detection capabilities. They enhance process stability significantly. Moreover, they support data-driven decision processes. However, they require proper implementation expertise. They also depend on historical data patterns.
Industry Statistics and Market Trends
The global quality management market demonstrates strong growth. MarketsandMarkets projects it reaching $25.3 billion by 2028. Manufacturing industries adopt SPC extensively. Additionally, industrial automation drives adoption further. Six Sigma implementations show 30% quality improvement typically.
PLCDCSHUB Technical Analysis
Control charts represent crucial automation monitoring tools. As PLCDCSHUB experts observe, they complement PLC and DCS systems effectively. Modern factories integrate SPC with control systems seamlessly. However, proper implementation requires statistical expertise. We recommend consulting PLCDCSHUB’s control system solutions for integration guidance. Our experience ensures successful SPC implementation.
Practical Implementation Scenario
A manufacturing plant implements X-bar control charts. They monitor critical dimension in automotive parts production. PLC systems collect measurement data automatically. The control chart detects gradual process drift. Maintenance adjusts equipment before defects occur. Consequently, scrap rates reduce by 40%.
Frequently Asked Questions
How do control charts integrate with PLC systems?
PLCs collect real-time process data from sensors. Control charts analyze this data statistically for quality monitoring.
What industries benefit most from control chart implementation?
Manufacturing, healthcare, automotive and electronics sectors achieve significant quality improvements through SPC.
How often should control limits be recalculated?
Review limits quarterly or after process changes. Significant variation patterns necessitate immediate recalculation.
For industrial automation and control system solutions, visit PLCDCSHUB.com