
Process Control Charts for Manufacturing Quality
Process Control Charts: Essential Tools for Manufacturing Quality and Efficiency
Process control charts provide critical insights for manufacturing operations. These statistical tools monitor process stability and identify variations effectively. They are essential components of modern quality management systems.
Statistical Process Control Fundamentals
Control charts analyze process behavior over specific time periods. They distinguish between common and special cause variations. This differentiation helps identify abnormal process conditions. Moreover, it enables proactive quality management.
Control Chart Components and Structure
Control charts feature several key statistical elements. The central line represents process mean performance. Upper and lower control limits define acceptable variation ranges. Additionally, data points show actual process measurements over time.
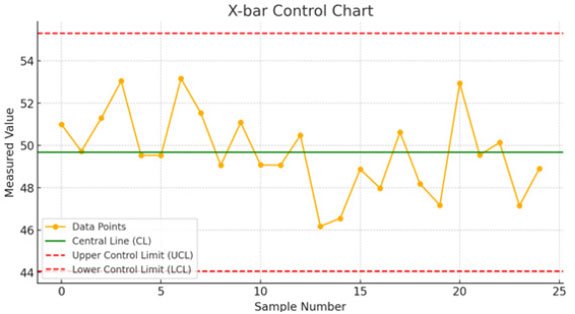
Variable Control Chart Applications
Variable charts handle continuous measurement data effectively. X-bar charts monitor process mean performance. R charts track variation ranges within subgroups. Furthermore, I-MR charts analyze individual observations.
Attribute Control Chart Usage
Attribute charts manage countable quality characteristics. P charts track proportion of defective items. C charts monitor defects per unit consistently. Moreover, U charts handle varying sample sizes efficiently.
Implementation Methodology
Control chart implementation follows systematic procedures. Teams collect sufficient baseline data initially. They calculate statistical parameters and control limits. Consequently, they establish reliable process monitoring systems.
Manufacturing Quality Context
The global quality management market demonstrates strong growth. According to MarketsandMarkets, it will reach $25.7 billion by 2028. Manufacturing represents the largest application segment. Companies increasingly adopt statistical quality tools.
Industrial Automation Integration
Modern control systems integrate statistical process monitoring. PLC and DCS platforms collect real-time process data. This enables automated control chart generation. Therefore, manufacturers achieve continuous quality improvement.
Key Implementation Benefits
- Early detection of process deviations and quality issues
- Improved process stability and predictability
- Data-driven decision making capabilities
- Reduced operational costs through waste minimization
- Support for continuous improvement initiatives
- Enhanced customer satisfaction through consistent quality
Implementation Challenges
- Initial setup requires statistical expertise and training
- Potential for misinterpretation of control chart signals
- Dependence on historical data for limit establishment
- Need for complementary quality management tools
- Regular maintenance and updating requirements
- Staff training and competency development needs
Automotive Manufacturing Scenario
An automotive parts manufacturer implements X-bar and R charts. The system monitors bearing diameter measurements continuously. Operators detect tool wear patterns early. This prevents defective part production and reduces scrap rates significantly.
PLCDCSHUB Technical Analysis
At PLCDCSHUB, we recognize control charts’ role in industrial automation quality systems. Modern control platforms automate data collection for SPC. The integration between real-time control and statistical analysis becomes increasingly important. We recommend starting with key process parameters when implementing control charts. Proper training ensures staff interpret chart signals correctly. Regular review maintains chart effectiveness over time.
Implementation Recommendations
- Identify critical process parameters for monitoring
- Establish adequate baseline data collection periods
- Train operators on chart interpretation and response
- Integrate with existing control and data systems
- Schedule regular chart review and maintenance
- Document procedures and response protocols
Frequently Asked Questions
- How often should control limits be recalculated? Review limits quarterly or after significant process changes, though continuous processes may require more frequent validation depending on variation patterns.
- What’s the minimum data points needed for reliable control charts? Most experts recommend 20-25 subgroups of 3-5 measurements each to establish statistically valid control limits.
- Can control charts work with automated manufacturing systems? Yes, modern systems integrate SPC directly with PLC and SCADA systems for real-time monitoring and automated responses to out-of-control conditions.


